How I Prepared the Eroom’s Law Figure
Where I Get Technical
Introduction
First, apologies. The past couple of weeks has gotten away from me. My time professionally and personally has been condensed and hard to properly budget. It may be like that for the next couple of months. Hopefully after June things will look up for me.
In my last post I gave my (chaotic) thoughts on Eroom’s Law. In this post I wanted to talk about how I made the figure. In short, this post will introduce another package that I have prepared - drug-nme
Motivations
I was always interested in figures and graphs of approved drugs. These are seen yearly at Nature Reviews Drug Discovery. I wanted to be able to pull the data myself. This led me down a rabbit hole where I pulled information from two sources - Guide to Pharmacology and the US FDA. It is called drug-nme and the repository can be found here. A future post will dive into why I built it and what I learned along the way.
I should give credit to two openly available resources – Phyo Phyo Kyaw Zin and a post I came across when searching how to create an Eroom’s Law figure by GitHub user mrtoronto (post here). The former taught me how to pull information from the US FDA. Much of that information was then folded into drug-nme. The latter showed me how to make a nice line plot for Eroom’s Law visualization.
What I Learned
For the Eroom’s plot, the biggest I learned was how to annotate a matplotlib figure. Specifically, that you can modify with text. I had no idea! It isn’t as straightforward as I thought. I’m a bit of an amateur with code in R, but “layering” figures in R makes more sense. Nevertheless, the notebook by mrtoronto was a great example to see. The other example was where to pull information concerning teh biopharmaceutical industry. I have never heard of the PhRMA organization. It is great to see that they post information available for download. For informatics, that means being able to scrape the relevant information for the Eroom’s plot. You can see that what I ended up with wasn’t too far off with the reference post. 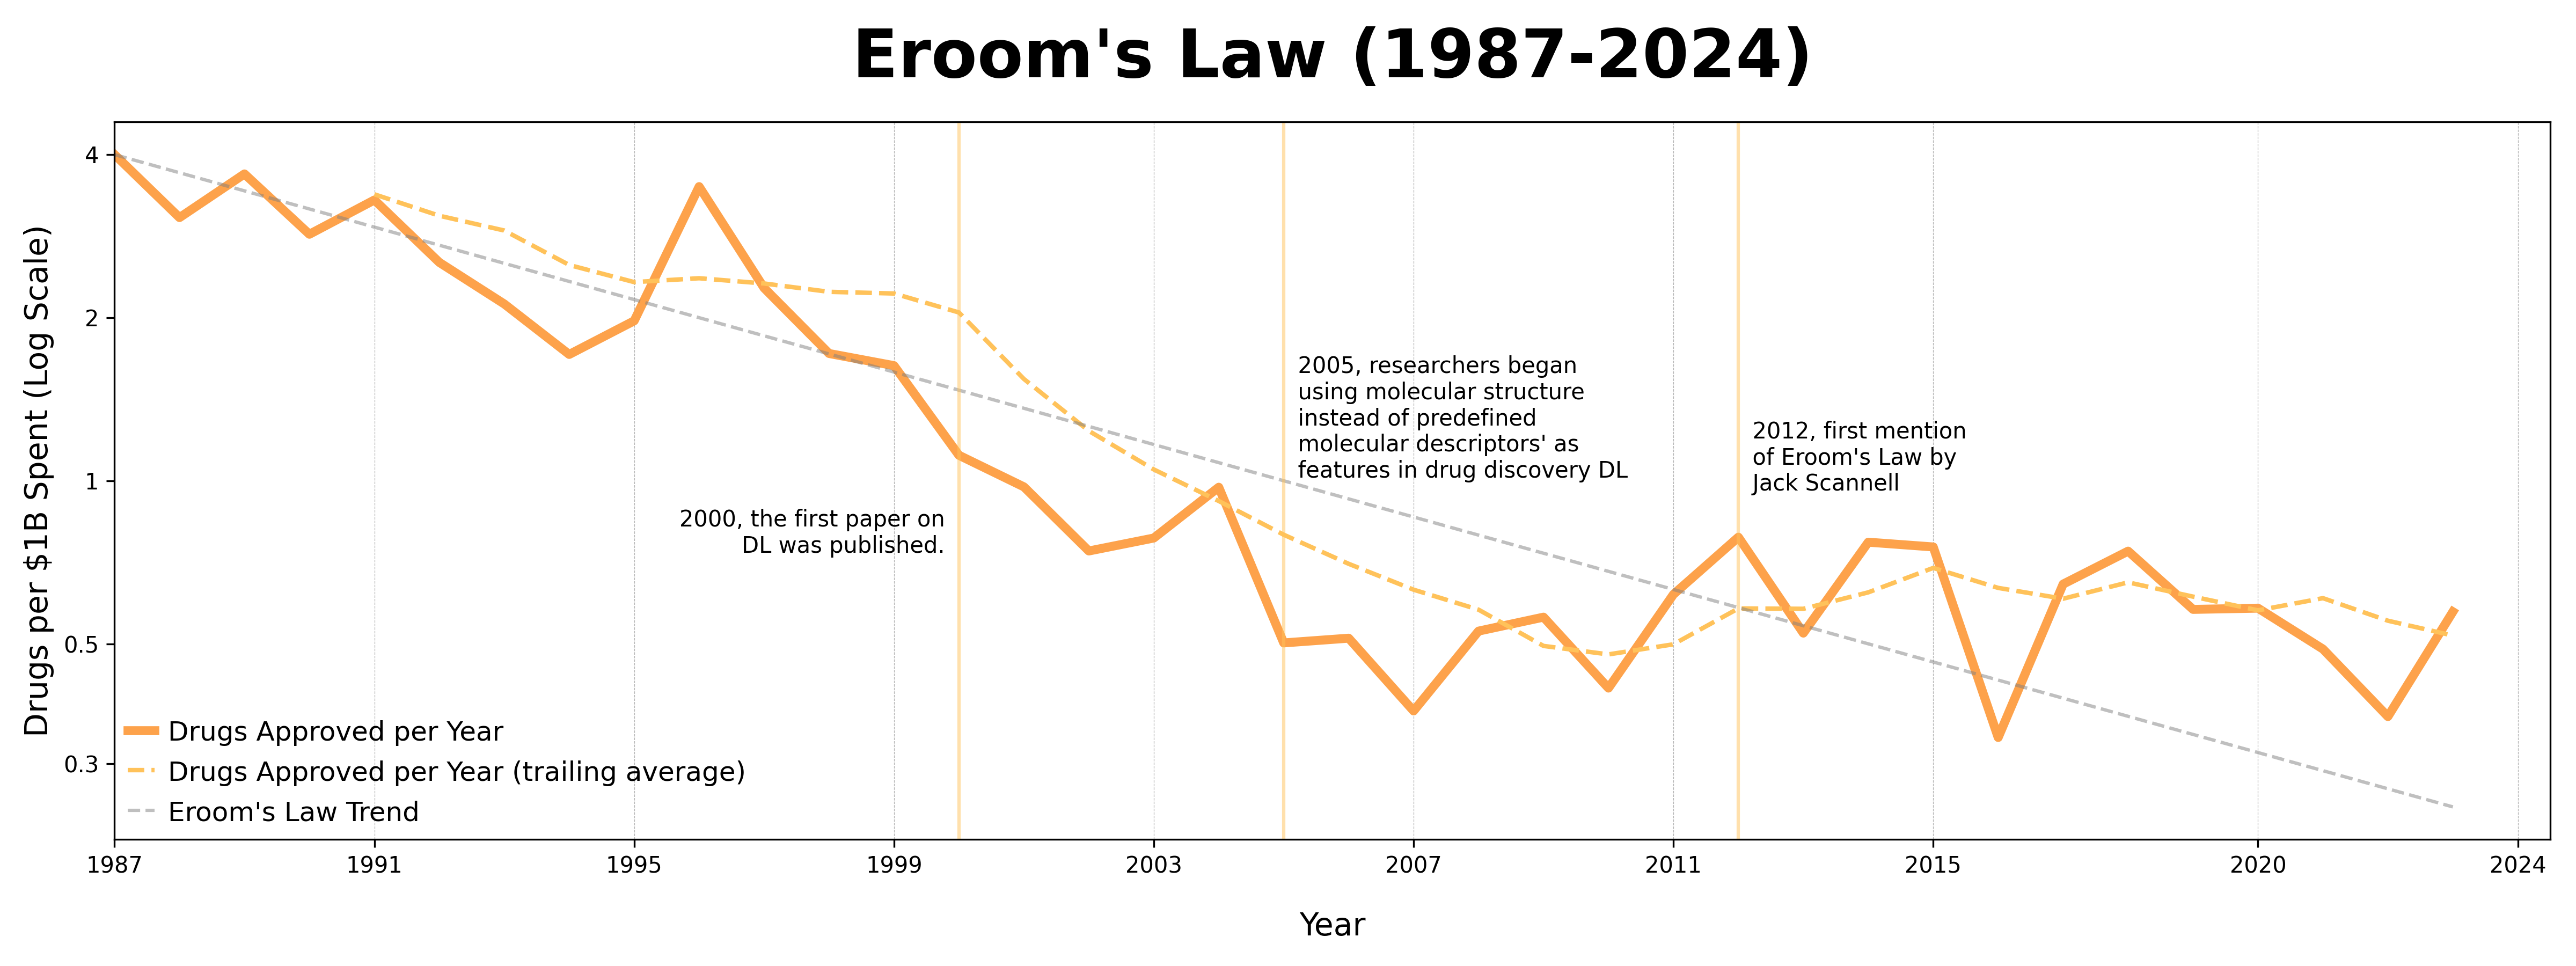
Conclusion
I think the final product looks pretty neat. Until the links break that is. I see myself visiting this script in a year’s time. The figure is nice to have and for Eroom’s Law I would like to see how that turns out in the future.